I load tested my chat app until it ran out of CPU
On this page
I’m building Flamingo Chat, an anonymous chat app for my campus. Before I let students in, I wanted one number: how many people can chat at once on the machine it runs on? I did not get one number. I got a table, a range, and a few surprises.
What it runs on
Everything runs on a single Google Cloud virtual machine: an e2-standard-2, which Google lists as 2 vCPUs and 8 GB of memory (Google Cloud docs). It is a one-node Kubernetes cluster in Mumbai. On that one machine sit eight Go services that talk to each other over gRPC, plus Kafka, Redis and Postgres, plus Prometheus, Grafana and Loki to watch it all. One copy of each.
A chat message crosses most of that: the gateway receives it from the sender’s WebSocket, the chat service puts it on Kafka, a delivery worker reads it and publishes it through Redis, and the gateway pushes it down the other person’s WebSocket. In parallel another worker writes it to Postgres.
The machine was not empty before I started. With nothing running it was already busy at roughly half a core, because the monitoring stack and Google’s own system pods live there too. So the app had about 1.5 cores to work with, not 2.
What I simulated
I used k6, a load testing tool, as a job inside the cluster, talking straight to the gateway. A k6 “virtual user” is one simulated person running a script in a loop. Mine signs up as a guest, opens a WebSocket, asks for a random match, waits for another virtual user, then sends a message every 3 seconds for 60 seconds. The partner times how long each message took to arrive, and both clocks are read inside the same k6 process, so there is no clock drift to correct for. Then the pair ends the chat and queues again.
Each level of load was its own run: 30 seconds ramping up, 120 seconds holding steady, 15 seconds ramping down. I ran 25, 50, 100 and 200 users, then 300, then 200, 225, 250 and 275, then 300 again. I had planned 400 and 600 but cancelled them once 300 showed the machine was saturated; they would only have shown a deeper collapse and risked knocking over the databases. A watchdog was ready to stop the run if any pod restarted or memory passed 93 percent. It never fired.
What came back
The number I care about is p95: 95 percent of messages arrived faster than this. Averages hide the slow ones, and the slow ones are what a person notices.
| Simulated users | p50 | p95 | p99 |
|---|---|---|---|
| 25 | 21 ms | 61 ms | 102 ms |
| 50 | 22 ms | 79 ms | 121 ms |
| 100 | 32 ms | 132 ms | 192 ms |
| 200, first run | 47 ms | 181 ms | 299 ms |
| 200, second run | 45 ms | 299 ms | 594 ms |
| 225 | 48 ms | 222 ms | 365 ms |
| 250 | 74 ms | 362 ms | 619 ms |
| 275 | 123 ms | 578 ms | 961 ms |
| 300, first run | 1023 ms | 5539 ms | 6588 ms |
| 300, second run | 169 ms | 719 ms | 1026 ms |
At 25 users the system delivered about 8 messages a second. At 300 it delivered about 98.
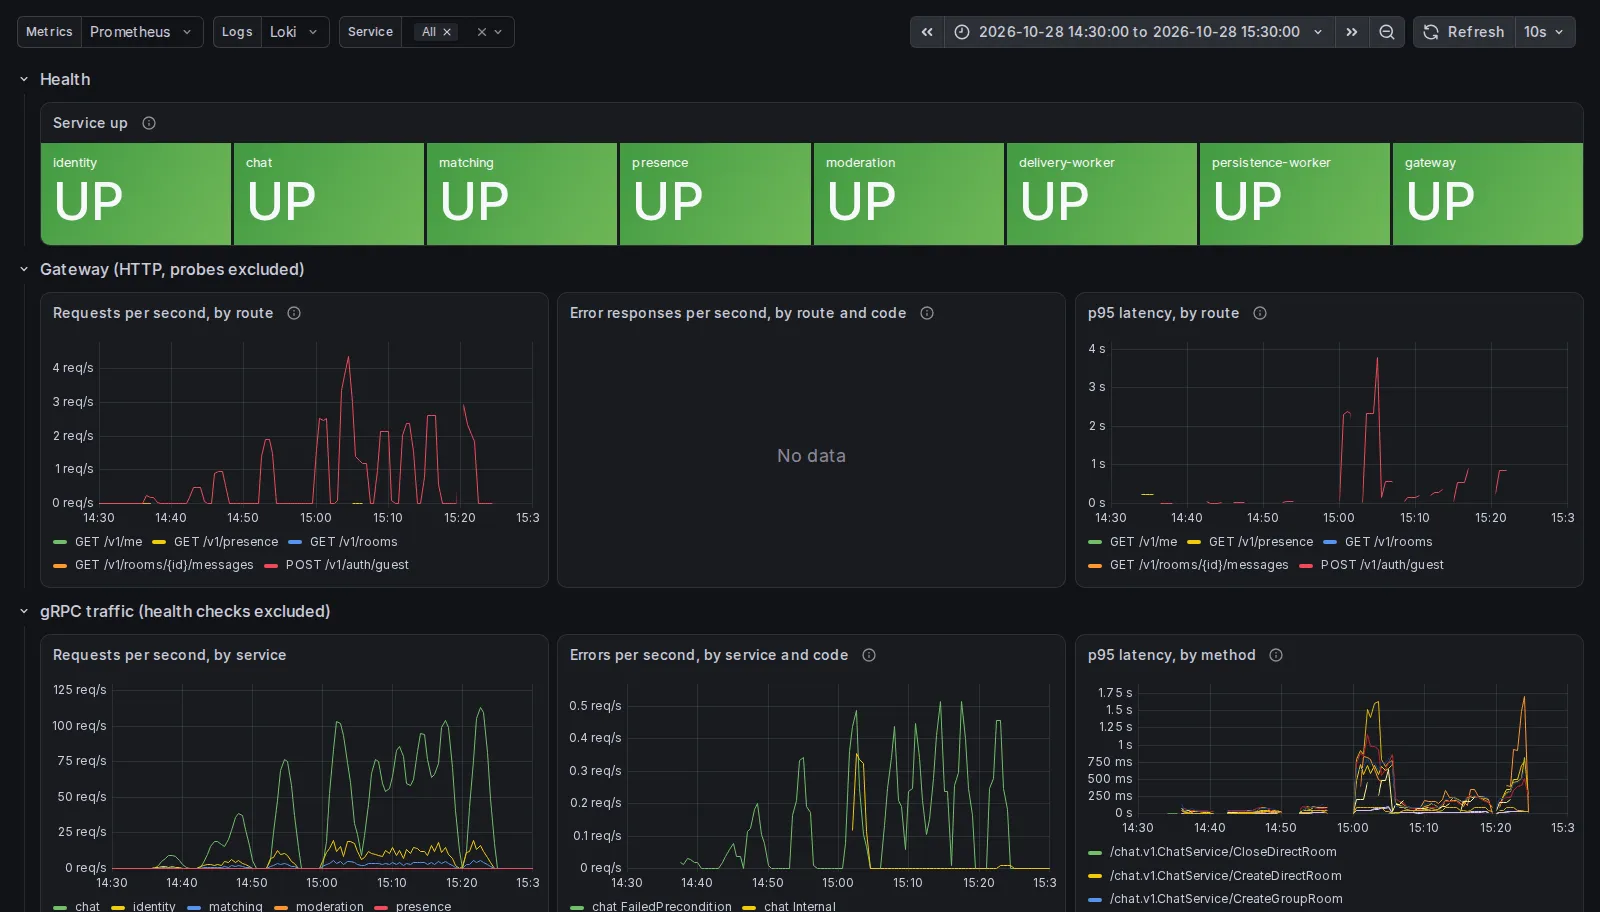
The whole test as the app’s own Grafana dashboard saw it, 14:30 to 15:30 UTC. Each bump is one run. These panels are per service, so they show the load arriving, not the CPU limit. The node CPU figures below come from the result files.
Where it ran out
The CPU ran out first. At 300 users the node used 1.98 to 2.00 of its 2.0 cores. The Linux kernel also reports how much of the time at least one task was waiting for a CPU (kernel docs on pressure stall information). At 25 users that peaked at 24 percent. At 275 users it was 96 percent, and at 300 it was 96 to 97 percent.
Nothing else was close to its limit:
- Memory in the 15-second samples peaked at 75 percent of the node, under the 93 percent line I had set for stopping.
- The busiest disk was never more than 22 percent busy.
- The gateway’s network traffic at 300 users was about 170 KiB/s in and 200 KiB/s out.
- Steal time, the CPU the host takes back from a virtual machine, stayed at or below 0.09 of a core. The kernel documentation only calls it “involuntary wait”, so I read it as a check that the neighbours were not the problem, not as proof.
- No pod restarted and the node count stayed at 1.
No single service was the culprit either. At 300 users the busiest were Postgres at 0.22 cores, the gateway at 0.16, Kafka at 0.15 and chat at 0.12. Each is a small slice of a 2 core machine. The machine hit its ceiling because all of them, the monitoring, the load generator and the kernel’s own network work share the same two vCPUs.
Three surprises
The same level gave very different answers. Near the limit the results are noisy. 200 users gave a p95 of 181 ms once and 299 ms the next time. 300 users gave 719 ms once and 5.5 seconds the next. In the 5.5 second run the chat service logged 40 internal errors, all “context canceled” inside database calls, and Kafka’s consumer lag peaked at 68 messages against 6 in the repeat. That fits requests being abandoned while waiting for a saturated CPU, but I did not establish the cause, so I won’t claim one. It also means I can’t give you one capacity figure. I’m reporting a range.
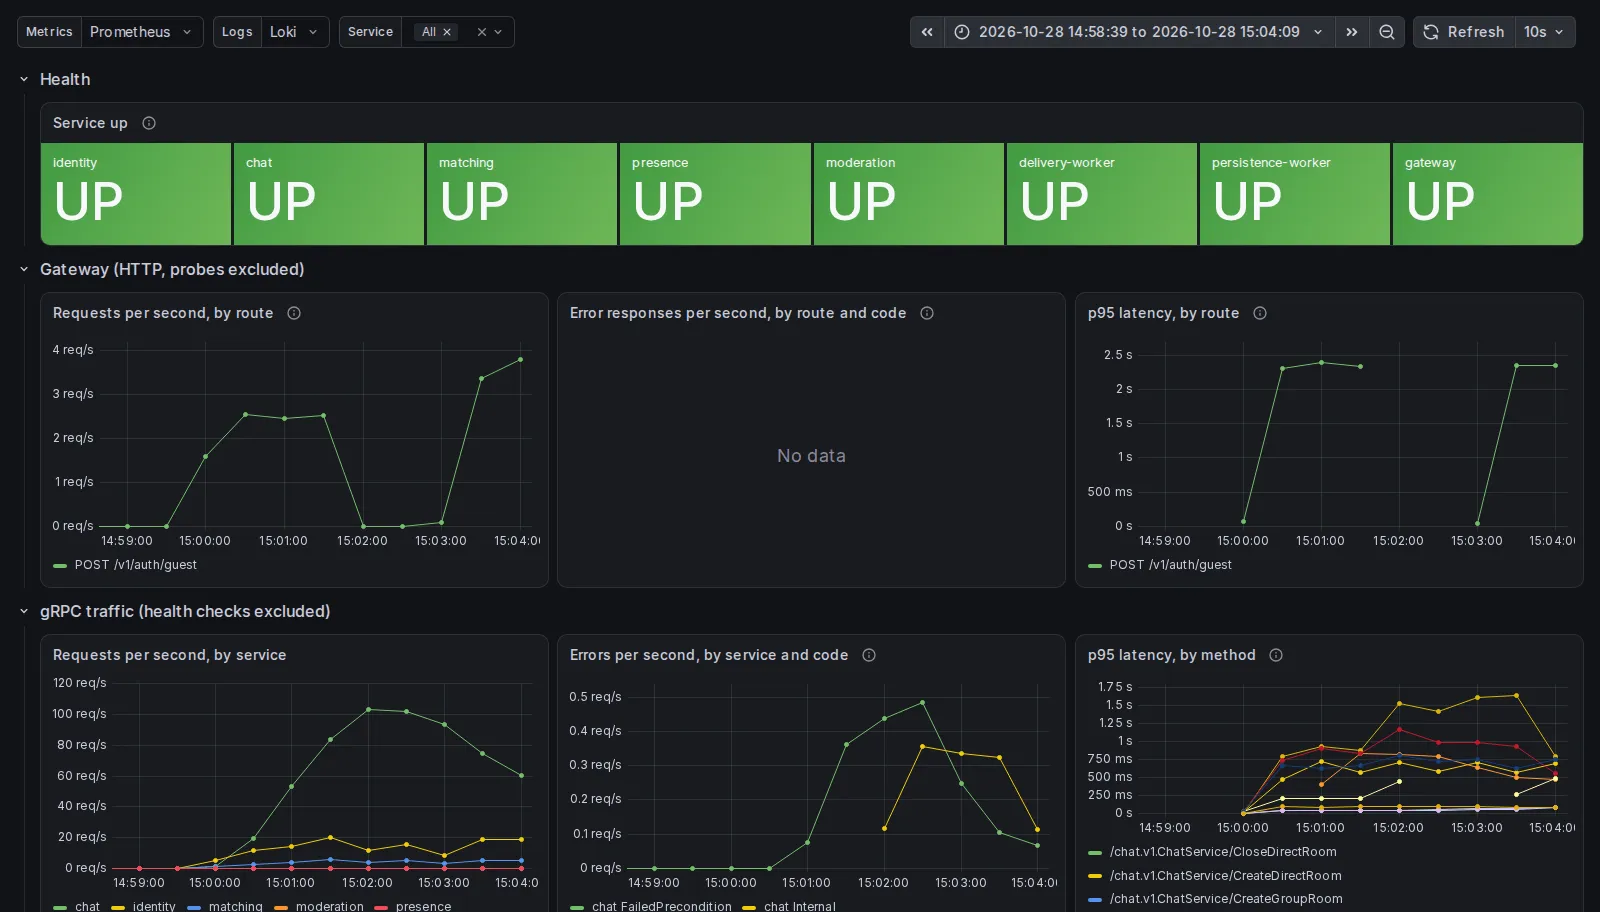
The slow 300 user run, 14:58 to 15:04 UTC. Guest signup p95 sits around 2.4 seconds, and the chat service is reporting both FailedPrecondition and Internal errors.
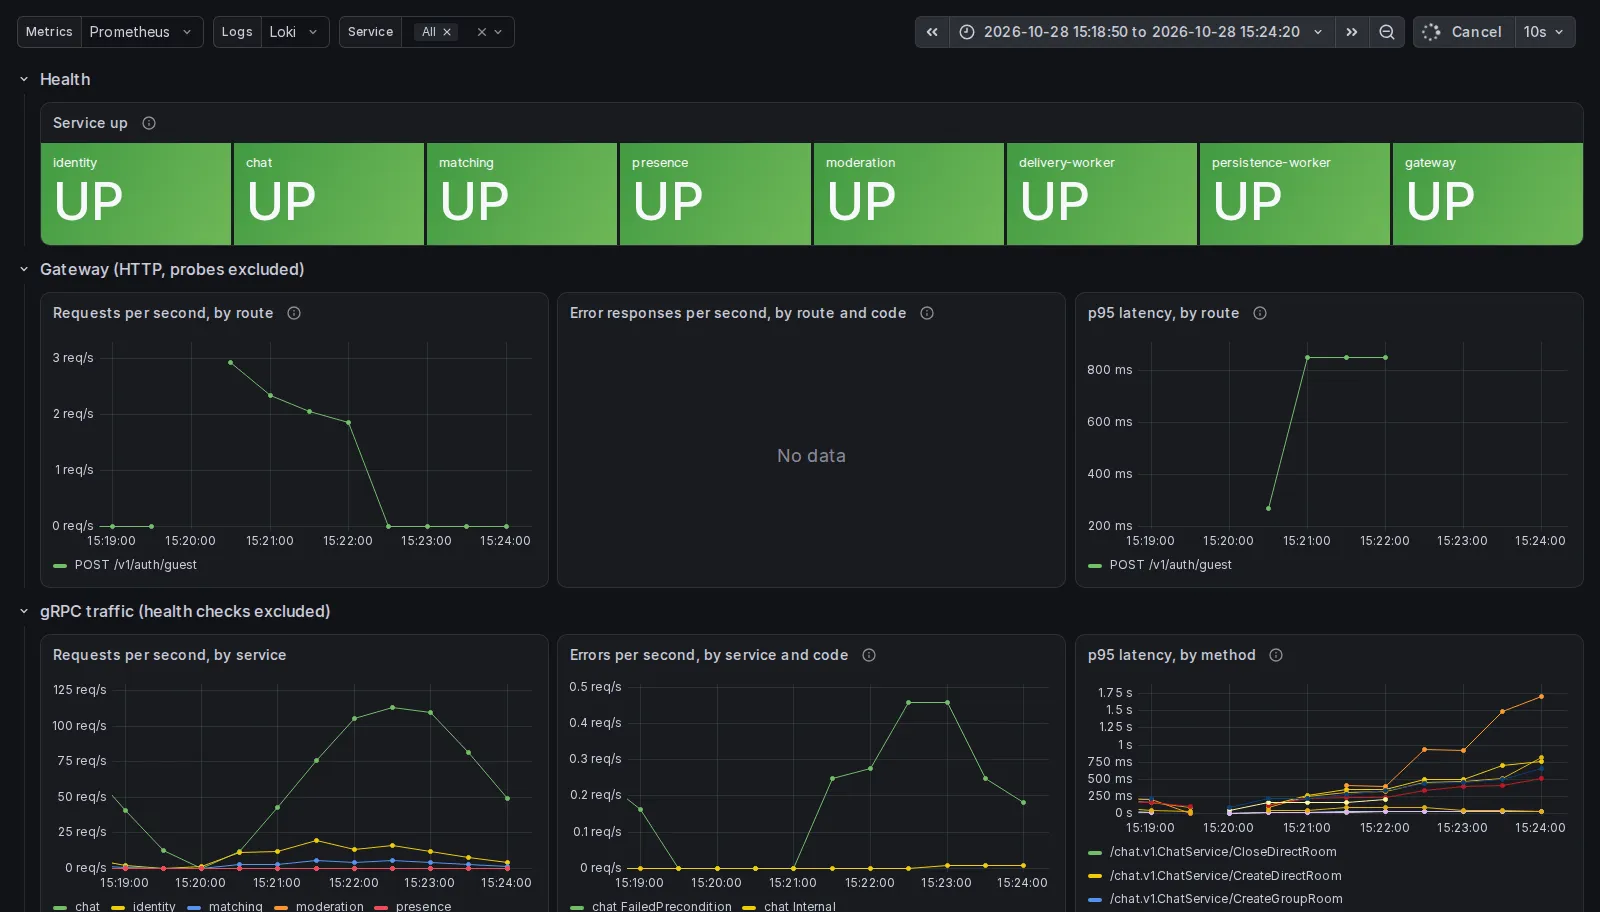
The repeat 300 user run, 15:18 to 15:24 UTC, on the same machine and the same build. Gateway p95 is around 850 ms and the Internal errors are close to zero.
My first reading of the errors was wrong. The results showed error frames from 100 users up, and my k6 threshold of fewer than 10 failed. When I looked in the chat service’s logs, 36 of the 38 errors in the first three levels were the server correctly refusing a message sent into a chat the partner had just closed. That is a race in my test script at the end of each session, not a backend fault. The script now counts those separately. I have not re-run the test with that change, so the error columns in the result files still mix the two.
My first attempt measured my laptop. I first ran the whole stack, the monitoring and the load generator on my laptop (12 CPUs, 8 GB under WSL). The load average passed 90 and services started crash-looping. Those numbers told me about the laptop. I threw them away and moved the generator into the cluster. That has a cost too, below.
What this does not show
- The generator shared the node. At 300 users k6 used 0.13 cores. That makes the backend’s numbers a little cautious, but it also means this is not how a separate load machine would behave.
- The traffic never went through Cloudflare or the internet. This is the backend, not a student’s phone.
- Simulated users are not students. Each sends a message every 3 seconds, steadily. Real chats come in bursts, and 300 virtual users are not 300 people with the app open. k6 calls this a closed model: a fixed number of users, each waiting on its own last iteration. Real students show up whether or not the app is keeping up (k6 docs).
- One or two runs per level, about 2.5 minutes each. No confidence intervals, and no soak test, so slow leaks over hours are untested. The second 200 user run also had 11 failed guest signups, which I did not investigate.
- One copy of everything. A restart of any service is an outage, and failover was not tested.
- It tested an older build. The results describe commit
b093bac. I have since changed the gateway and chat service to fix refresh and reconnect bugs, and those changes add some work per user. Before I quote a number for the current release I need to re-run it.
What’s next
A separate machine for the load generator, a long soak run, a run through Cloudflare, and two gateway replicas. None of these are done yet. The scripts, the machine and software details, and every result file are in the repository: loadtest/results, with the method in loadtest/k6/chat.js and loadtest/run.sh.